Railroads and the Making of Modern America: Tools for Spatio-Temporal Visualization
Report to the National Endowment for the Humanities
Digging into Data Challenge
June 9, 2011
[note: Richard G. Healey, University of Portsmouth, began our presentation with a discussion of the overall goals of the project and the GIS effort; Ian Cottingham, University of Nebraska, followed with a detailed description of the Aurora Engine and our “Apps” being developed in our software framework for integrating and visualizing large-scale data. This talk was shortened considerably at the NEH in the interest of time but presented here in full.]
From our Richmond Daily Dispatch “App”, I think you can see that we are interested in using spatial visualization to allow deeper research, to make connections by seeing historical processes unfold at various scales. This tool, we hope, helps us read newspapers differently–with spatio-temporal context in the foreground.
I want to point out that in the four years of the Dispatch (100,000 articles, 24 million words) we found 8,300 unique place names, and these places were mentioned in 292,000 occurrences.
When we combine rich and accurate geocoding with sentence-level keyword searching, we are able to look at occurrences in a different, perhaps more revealing way. We can find, for example, a pattern in newspaper mentions of “contraband” places that we may not have fully seen or considered, especially when mapped over time in the Civil War. There were numerous references to what were called “contrabandville”s. And we can begin to map their locations, which ones were near railroads. We can we trace African American names of railroad workers, extract those and relate them to other data in our system, including payroll records and census records.
Now, 10 years ago, before setting out on my “railroad journey,” I wrote with youthful enthusiasm the following optimistic assessment of where I was going with the Aurora project:
“We have what earlier generations of social science historians could not imagine: a high speed and widely accessible network linked to cheap and powerful computers running common software with well-established standards for the handling of numbers, texts, and images. Now we need to design the portals into that network that let people collaborate in a disciplined, cumulative, and verifiable way. . . . The data exists all over the country in easily accessible form.”
I admit that this was a rather breezy assessment of the state-of-the-field in digital humanities.
The data in fact exists all over the country, but it is not in an easily accessible form.
We do, however, have tools now that earlier social scientists would envy. On a recent trip to the Newberry Library, I saw an entry in the Burlington Railroad finding aid: for a CDROM of all employees blacklisted between 1877 and 1892. This was the work of Paul Black, an economic historian at University of California, Long Beach, who studied railroad workers back in the 1970s. The CD contained a pdf of the computer ascii print out of Black’s data set in QLISTFORMAT–in fields by last name, occupation, place, date, and reason or cause for dismissal, as well as whether they were reinstated. This is a 200 MB file with over 8,000 railroad workers listed.
Black could do a great deal with this database, and he was at the time one of the leading quantitative historians. He could sort it by place or location and use location as a variable.
But there was much that he could not do, could not discover. He could not spatially relate his data–to the census data you just saw, to the Freedmen’s Bureau data we’ve assembled, to other railroad occupational data, to county-level political data. And he could not easily visualize these data and their spatial relationships.
Black largely worked on this alone and published a single, very useful scholarly journal article from it.
But the model for this scholarship has changed. We do need to “collaborate in a disciplined, cumulative, and verifiable way.” This is one of the main goals of our project, it turned out, and to me it’s lasting importance.
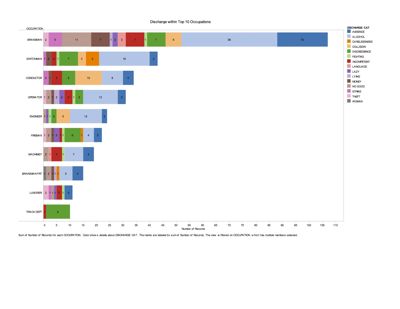
Our team partners at Stanford’s Spatial History Lab (Richard White, Kathy Harris, and Erik Steiner) have been working with us to use Black’s list and produce visualization models. They were able to bring in the As and Bs (over 400 records) as a sample. Here are several of the tableau visualizations of this data produced at Stanford in collaboration with us:
|
C.B.&Q. Railroad Discharges by Top Ten Occupations:
|

|
|
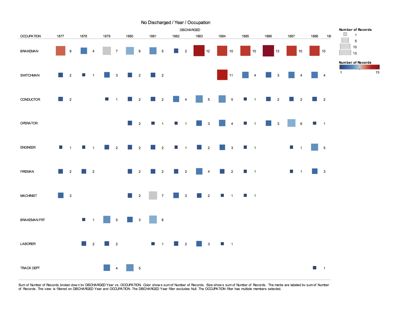
C.B.&Q. Railroad Discharges by Year by Occupation:
|

|
|
|
C.B.&Q. Railroad Discharges by Month by Occupation:
|

|
|
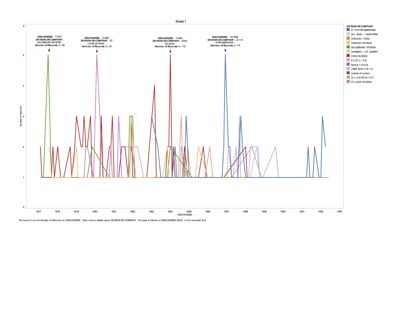
C.B.&Q. Railroad Discharges Trend Line by Occupation:
|

|
|
At this point I would like to thank Ian Cottingham, our software architect, but also Leslie Working, our project manager, and the undergraduate students who have worked on this project, Miles, Luci, and Brian.
This is the most exciting prospect of the project for us: changing the pattern of humanistic work to enable focused scholarly teams to improve the quality and usability of large-scale data. Students for example in a Civil War course would learn much more about the war, its geography, social experience, and political conflicts by mapping and encoding places and semantic concepts in newspapers, using our Aurora framework, than by more traditional means. And the coding they do can then can be gradually machine assisted to work on larger data sets.
It seems to us that this model is the way forward. We want to mobilize an intensive expert base necessary to prepare, analyze, and visualize data, a tool set necessary to work within and among these data, and a scholarly community necessary to scale-up wider applications for the data.
If we are to make our digital work “cumulative and verifiable,” we face a social question: how do we allow, reward, encourage, and review historians who work in teams? The large scale data in the Digging into Data challenge requires us to work in larger scholarly networks of experts and colleagues. This in itself will require substantial change in behavior, in patterns of scholarly work, in promotion and tenure. We can imagine that the future of digital history and digital humanities will look something like the work of physicists in the Large Haldron Collider in which thousands of investigators work together and write papers.
Indeed, we might think of large-scale data visualization for history as something like a particle in an accelerator: we cannot see the particles themselves, but we can see the patterns they make in a medium. In the spatial medium, the latent becomes manifest, invisible becomes visible. As Marc Bloch wrote, time is ‘the very plasma in which events are immersed, and the field within which they become intelligible.'”
By working together, by bringing expertise together, we discovered patterns once not visible but suddenly apparent: the widespread absence and geographic distribution of African American railroad workers in the North and, conversely, the extent, depth, and geographic distribution of African American railroad workers in the South. We now have an occupational and geographic profile of black railroad workers that we did not have before. And we are producing journal articles now with five authors–not quite the thousands in the LHC project, but many more than usual in the humanities.
Other patterns too came forward as new areas to investigate. African American post emancipation mobility and its relationship to the railroads and rail employment appeared surprisingly disconnected. We found almost no railroad labor contracts in the Freedmen’s Bureau series for important rail centers, such as Petersburg, Virginia, Memphis, Tennessee, Alexandria, Virginia, and Louisville, Kentucky. Perhaps, black railroad workers stayed with their companies through emancipation. Perhaps, the jobs were contracted through other more local means, such as word of mouth, family relationships, or patronage. This raises important questions about the transition from slavery into emancipation and the process in industry and urban settings.
In 1861 Charles Joseph Minard developed a path-breaking graph of the Napoleonic War which combined weather, casualties, terrain, and time. His representation of the attrition on Napoleon’s army has become an iconic classic in the art of visual complexity. The graph related the different data in an elegant visual narrative of such power that it has influenced scholars ever since–from historians to computer scientists. The leading scholar of visual information, Edward R. Tufte, considered it possibly “the best statistical graphic ever drawn.” Yet, Minard drew his first such graphs for railroads in France and developed his technique in works combining traffic and distances. In 1845 he published what he called his first “figurative map” (“cartes figuratives”) describing the effects of the railway between Dijon and Mulhouse in France. “It is by sight alone,” Minard explained in 1861, “that this map, which was found to be eloquent, made visible the relationship between the numbers of travelers, because it will be noticed that it does not carry a single numeral.”
Minard’s work, however much the product of his genius, was also part of the modern railway culture. The railroad inaugurated fresh approaches to visual information. One should be able to “glance at a map” and extrapolate quickly the time, distance, and world one might encounter. Minard, more than perhaps anyone of his generation, experimented with the forms for conveying multiple sources of information. The practices that railroads and telegraphs helped shape in the United States (and Europe) continued long after the Civil War, and so did the incongruities they also generated. Railroads especially affected conceptions of time and personal mobility, boosted confidence in empirical and statistical information, and reinforced ideas about the ways modern societies controlled nature. They created and sustained increasingly complex interfaces–atlases, bridges, tunnels, and timetables to name a few. Using digital sources and techniques, we have assembled some lost histories of these data in nineteenth-century American society.
All of this is to say that until quite recently historians had no or limited means of spatial discovery, only illustration. We are on the cusp of not only new discoveries, maps of our history never created before, and we are on the cusp of a new shape to our scholarly practice.
Notes: Charles Joseph Minard, Des Tableaux Graphiques et des Cartes Figuratives (Paris, 1862) translated by Dawn Finley. < http://www.edwardtufte.com/tufte/minard-maps>. Edward Tufte, The Visual Display of Quantitative Information (Cheshire, Ct.: Graphics Press, 1983): 40-45. About Minard’s Napoleonic War map, Tufte points out that “viewers are hardly aware that they are looking into a world of four or five dimensions.” Also Edward R. Tufte, Visual Explanations: Images and Quantities, Evidence and Narrative (Cheshire, Ct.: Graphics Press, 1997).


